
Dashboard examples
A closer look at monitoring.
Explore screenshots from Grafana dashboards. These are static captures, separate from the interactive sample below.
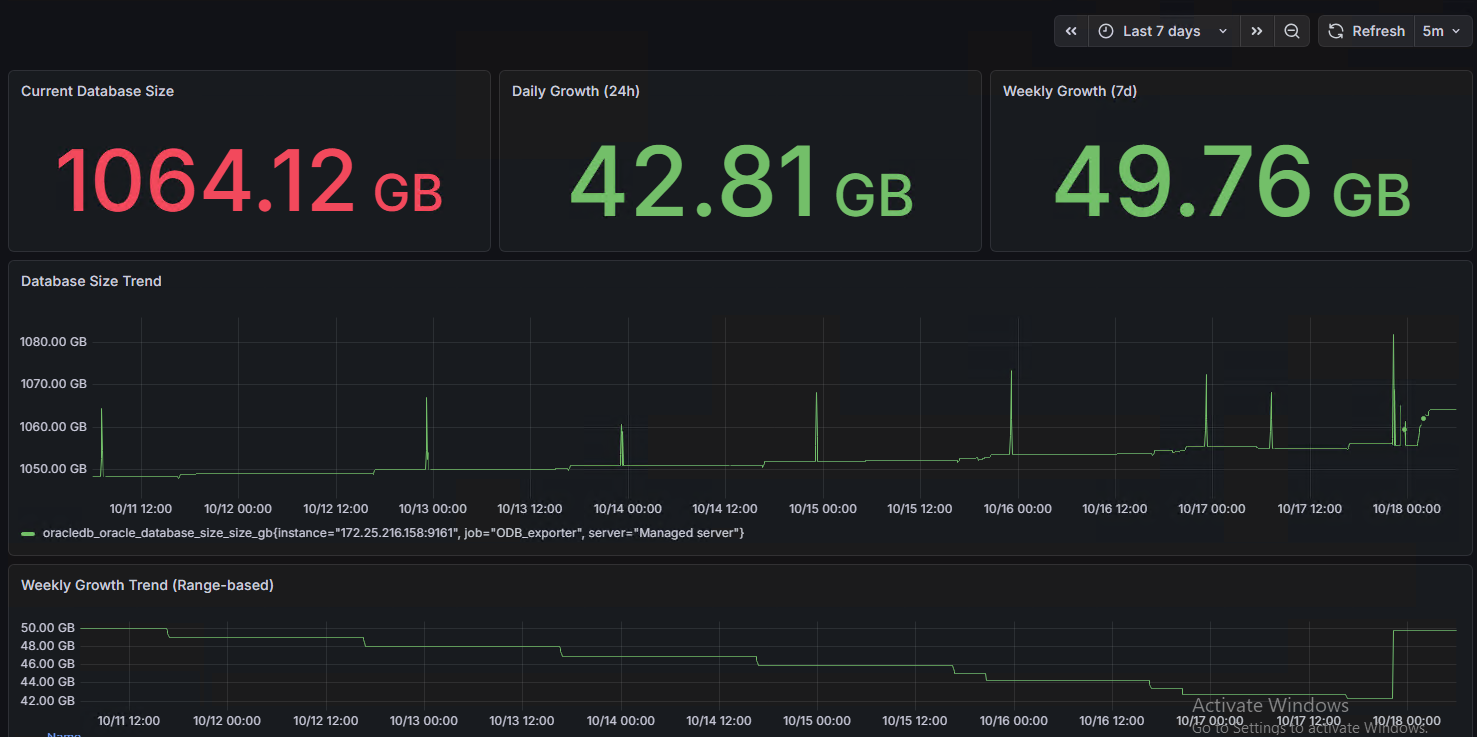 Database size and growth trends
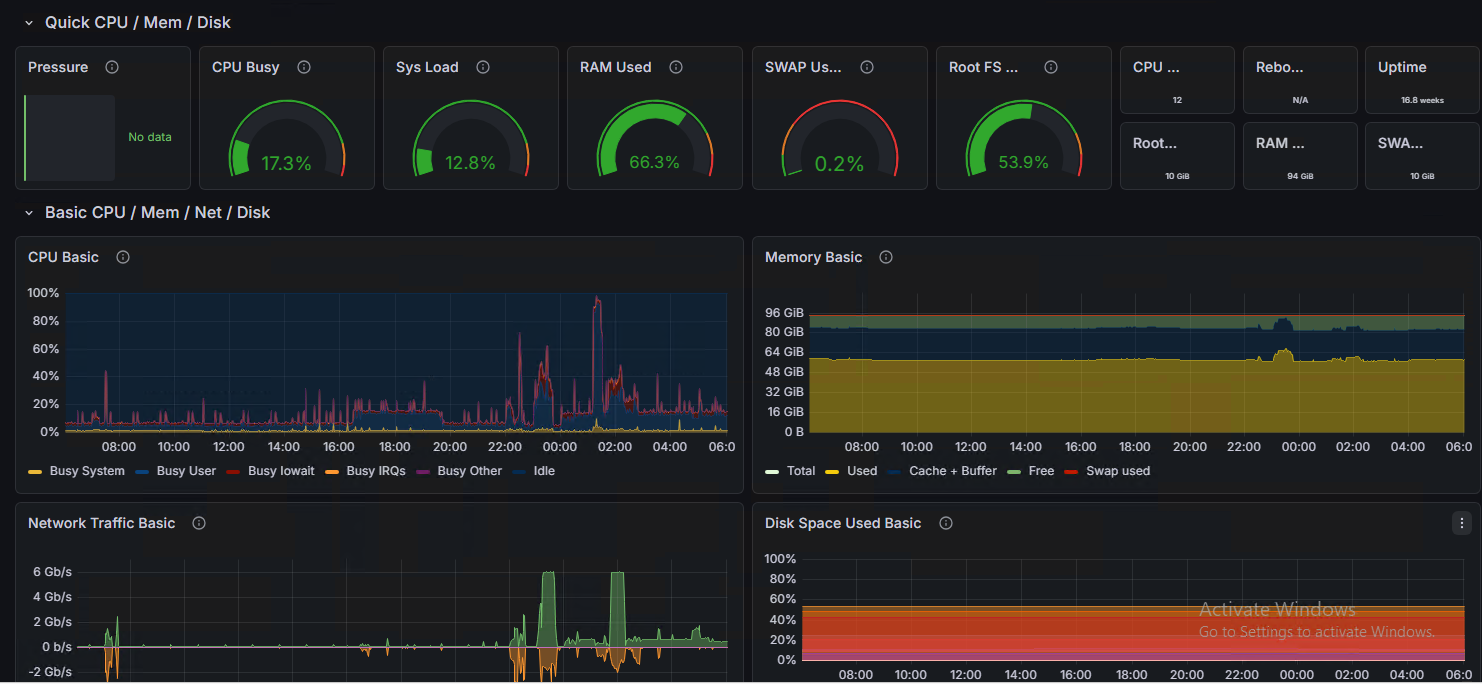 CPU, memory, network and disk performance
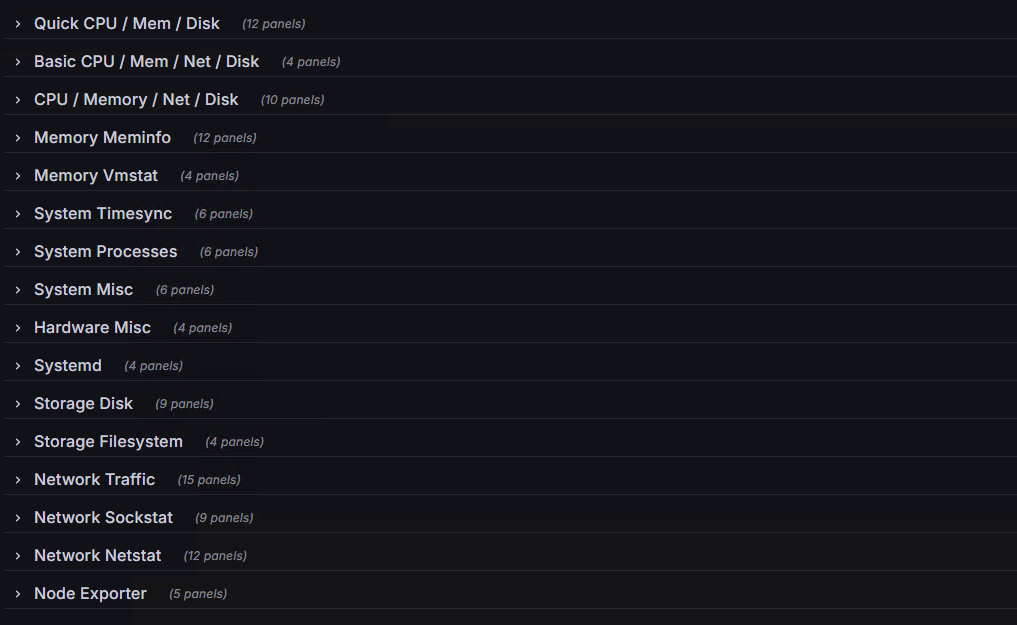 Available infrastructure monitoring categories
 Database tablespace usage over time
Select any screenshot to view it at full size.
Grafana-style Monitoring
Interactive demoGenerated sample data · Not a live Grafana instance.
Make it yours
Explore infrastructure dashboards.
Generated sample data · Not a live Grafana instance.